
DSP background

Chicago Is Down to Three Hospital Systems. Your Carrier Can't Say No to Any of Them.

Oct 15, 2026, 8:59:24 AM / by Blake Erickson posted in Benefits

0 Comments

On October 14, Rush University System for Health and Endeavor Health announced plans to merge. Twelve hospitals. More than 400 sites of care. Nearly $11 billion in revenue. The headlines called it the largest health system in Chicago.

That is true if you count hospitals, and only by one. Northwestern Medicine has 11. Advocate has 11 in the region. Take out Endeavor's behavioral health hospital and it is a three-way tie.

So the size is not the story. The story is what is left when the deal closes: three systems that every carrier in Chicago needs in its network, and very little room to say no to any of them.

How Chicago Got Here

Chicago did not consolidate overnight. It happened one deal at a time, and each one looked reasonable on its own.

NorthShore University HealthSystem absorbed Swedish Covenant in 2020 and Northwest Community in 2021. It merged with Edward-Elmhurst in January 2022 and renamed itself Endeavor at the end of 2023. Now Endeavor joins Rush, and the Endeavor name goes away.

Advocate combined with Aurora in 2018, then with Atrium Health in 2022 to form one of the largest nonprofit systems in the country. Northwestern grew the same way, adding Central DuPage and Delnor in 2014 and more suburban hospitals since.

Here is the part worth remembering. In 2017, the FTC and the State of Illinois went to federal court to stop Advocate and NorthShore from merging. They won, and the two systems walked away. Nine years later, NorthShore's hospitals are headed into a system with more hospitals than anyone else in the region. It just took four deals instead of one (consolidation is patient).

What This Looks Like From the Negotiating Table

Employers do not negotiate hospital prices. Carriers and networks do, on your behalf, in rooms you are never in.

A carrier's power in those rooms comes from one thing: the ability to walk away. A carrier can leave a mid-size system out of network and still sell a credible product. Leaving out 12 hospitals across the North Shore, the city and the western suburbs is a different conversation. Large systems know that, and they often negotiate all or nothing. Every hospital stays in network at the system's rates, or none of them do.

There is local overlap, too. Rush Copley in Aurora and Edward in Naperville serve neighboring communities. Rush Oak Park and Elmhurst Hospital sit a few suburbs apart. Expect regulators to look hard at those pairs.

When a market gets down to three must-have systems, the carrier stops negotiating the price and starts negotiating how much of an increase it can live with.

What the Research Says Happens Next

This is not a guess. Economists have studied hospital mergers for decades, and the pattern holds.

6%+ Price increase when merging hospitals sit about 5 miles apart or less Cooper, Craig, Gaynor & Van Reenen, Quarterly Journal of Economics (2019) 7% to 9% Price increase at acquiring hospitals when a system buys a hospital elsewhere in the same state Dafny, Ho & Lee, RAND Journal of Economics (2019)
12% Higher prices at monopoly hospitals than at hospitals facing four or more rivals Cooper, Craig, Gaynor & Van Reenen (2019) 30 days Minimum notice Illinois requires to the Attorney General before a health care deal like this closes Illinois Antitrust Act, Section 7.2a

The second number matters most for Chicago. Dafny's team found that prices rise even when the merging hospitals do not compete for the same patients. The driver is bargaining power with insurers. Distance does not protect you.

What It Costs a Mid-Market Plan

If you are self-funded, you can run this on your own claims. Here is an illustrative version, with round numbers chosen for clean arithmetic.

250-employee self-funded plan Illustrative
Annual medical claims $3,000,000
Claims paid to Rush and Endeavor facilities $1,200,000
Price increase on that spend 6% to 9%
Added cost per year $72,000 to $108,000

Every year after, compounding with trend. It will not arrive at your next renewal. Carrier contracts with hospital systems typically run multiple years, so new rates show up as those contracts come up. That gap is your window.

Fully insured groups will not see a line item. The increase gets folded into trend and shows up as a renewal number nobody can fully explain. Self-funded groups see it in claims data, hospital by hospital, and they feel it twice: higher unit costs push more large claims past the stop-loss deductible, and specific premiums follow.

If You Are Self-Funded or a Larger Group

None of this calls for panic. It calls for doing the work before the contracts reprice. These moves assume you can see where your claims go: self-funded plans, and fully insured groups large enough to be rated at least partly on their own experience (in Illinois, typically 51 or more employees), who can often get facility-level reports from the carrier.

  • Measure your exposure. Pull 24 months of claims by facility. What share of your spend goes to Rush and Endeavor today? If you are fully insured and cannot get that report, that tells you something too.
  • Ask about contract timing. When does your carrier's or TPA's contract with each system renew? Does it allow tiering or steering?
  • Move shoppable care. Joint replacements, imaging and infusions rarely need an academic medical center. Centers of excellence and site-of-care programs often beat the local hospital on price and outcomes.
  • Price reference-based pricing for part of the plan. Paying a set multiple of Medicare caps your exposure to whatever the merged system negotiates. The vendor you pick matters as much as the model.
  • Watch the regulators. The FTC and Illinois can still challenge the deal or change its terms. Nothing is final until it closes, expected in early 2027.

If You Are a Smaller, Fully Insured Group

Most of what is above assumes you can see your claims and steer where care happens. Plenty of employers cannot. If you have 50 or fewer employees and buy a fully insured plan in Illinois, here is the honest version.

Your rates are filed with the state and pooled with every other small group your carrier insures. Your own claims history does not move your premium, and there is no hospital contract you get to negotiate. When the merged system reprices, it shows up in everyone's rates at once.

That does not mean you have no moves. They are just different moves.

  • Shop the network, not just the rate. At renewal, compare plans built on narrower or tiered networks. Some leave out or tier the highest-cost systems, and they are priced accordingly.
  • Use the tools you already pay for. Federal transparency rules require your carrier to give members an online cost estimator. An MRI at a freestanding imaging center often costs far less than the same scan at a hospital outpatient department. Show your employees where to look.
  • Know whether your group can leave the pool. This is where your group's health matters. It does not change your small group premium, but it decides whether you qualify for arrangements priced on your own group, like level-funded plans, instead of the whole market.
  • Ask what exists below the radar. DSP works with alternative arrangements built for groups as small as five enrolled employees (most small employers have never heard of them). They are not right for every group, but they are worth a conversation before your next renewal, not after it.

The Promise and the Price

Every one of these deals comes with promises: better access, more research, higher quality. Some of that may prove real. Rush and Endeavor have pledged $1 billion tied to the merger, including $500 million for academics and research.

But employers fund those promises through the price of care. Chicago is becoming a three-system market, and three-system markets do not get cheaper on their own. The employers who come out ahead, at any size, will be the ones who know their exposure and have options ready before the next contract cycle, not after it.

Know your exposure before the contracts reprice.

DSP's employee benefits team helps Chicago-area employers break down claims by facility, model hospital price exposure, and build steering, center-of-excellence and reference-based pricing options for fully insured, level-funded and self-funded plans, and we bring smaller groups options most brokers never put on the table. If Rush or Endeavor facilities show up in your top claims, or your small group renewal keeps climbing with no explanation, that is the conversation to have.

Talk to Our Benefits Team Explore Employee Benefits

Or call 847-934-6100  |  info@dspins.com

Sources

  1. CBS Chicago, Rush University System and Endeavor Health announce merger (October 14, 2026). Deal terms, leadership, $1 billion investment, expected early 2027 close.
  2. Fierce Healthcare, Rush University System for Health, Endeavor Health unveil 12-hospital merger (October 2026). 12 hospitals, nearly $11 billion in revenue.
  3. Daily Herald, Endeavor Health and Rush University System for Health announce plans to merge (October 14, 2026). Northwestern Medicine and Advocate hospital counts.
  4. Federal Trade Commission, After Two Chicago-area Hospital Systems Abandon Proposed Merger, FTC Dismisses Case (March 2017).
  5. Zack Cooper, Stuart Craig, Martin Gaynor and John Van Reenen, The Price Ain't Right? Hospital Prices and Health Spending on the Privately Insured, Quarterly Journal of Economics 134(1), 2019.
  6. Leemore Dafny, Kate Ho and Robin Lee, The Price Effects of Cross-Market Mergers: Theory and Evidence from the Hospital Industry, RAND Journal of Economics, 2019.
  7. Illinois Attorney General, Notifying the Attorney General of Covered Health Care Transactions.

This article is for educational purposes and reflects public information as of October 2026. The Rush and Endeavor merger is pending state and federal regulatory approval, and its terms may change. This is not legal, tax, actuarial, or insurance advice. The claim and price figures in the worked example are illustrative, chosen for arithmetic clarity, not benchmarks or a forecast for any specific plan.

Read More

Being the Leader She Needed: Hard-Won HR Lessons on Careers, Benefits, and Trust

Sep 30, 2026, 9:15:04 AM / by Blake Erickson posted in Benefits

0 Comments

Amy Smith's LinkedIn banner reads: "Being the leader that she needed when she started her career." On the latest episode of DSP's podcast, Uncovered, host Blake Erickson sat down with Amy, HR Manager at Vittori Health, to find out what that means and what HR professionals, executives, and benefits brokers can learn from a career built without a roadmap.

Amy didn't follow the traditional path into HR. Widowed at 28, she needed a better job quickly and applied for a cash office position at Lowe's. Two months later, she was asked to step into the HR role. She fell in love with the work and has been doing it ever since.

Read More

Why Water Damage Claims Get Denied (And How to Avoid It)

Sep 17, 2026, 10:14:50 AM / by Laura Wywial posted in Personal Insurance

0 Comments

Water damage is the claim most homeowners assume their policy will simply cover. It usually does, until the adjuster draws a line between something that happened to your home and something that happened because of it. That line is where a surprising number of claims get denied, and most homeowners don't find out where it sits until they're standing in a wet basement. 

Read More

Your Team Is Using AI. Is Your Insurance Program Keeping Up?

Sep 10, 2026, 1:31:34 PM / by DSP Insurance Services posted in Business Insurance

0 Comments

AI-enabled tools are increasingly finding their way into businesses of all types, including manufacturing, construction, professional services, distribution and many others.

Read More

E-Bikes and E-Scooters: The Speed Is the Feature. It's Also the Risk.

Aug 20, 2026, 1:26:43 PM / by DSP Insurance Services posted in Business Insurance

0 Comments

If you or your family ride an e-bike or e-scooter, the deductible on your judgment isn't the vehicle's top speed, it's the gap between how fast the motor gets you there and how much riding experience you actually have. That gap is where most e-bike injuries are happening, and it's widening faster than most riders realize. 

Read More

Employment Practices Liability Trends Employers Should Watch in 2026

Aug 13, 2026, 1:13:02 PM / by Mike Pohl posted in Business Insurance

0 Comments

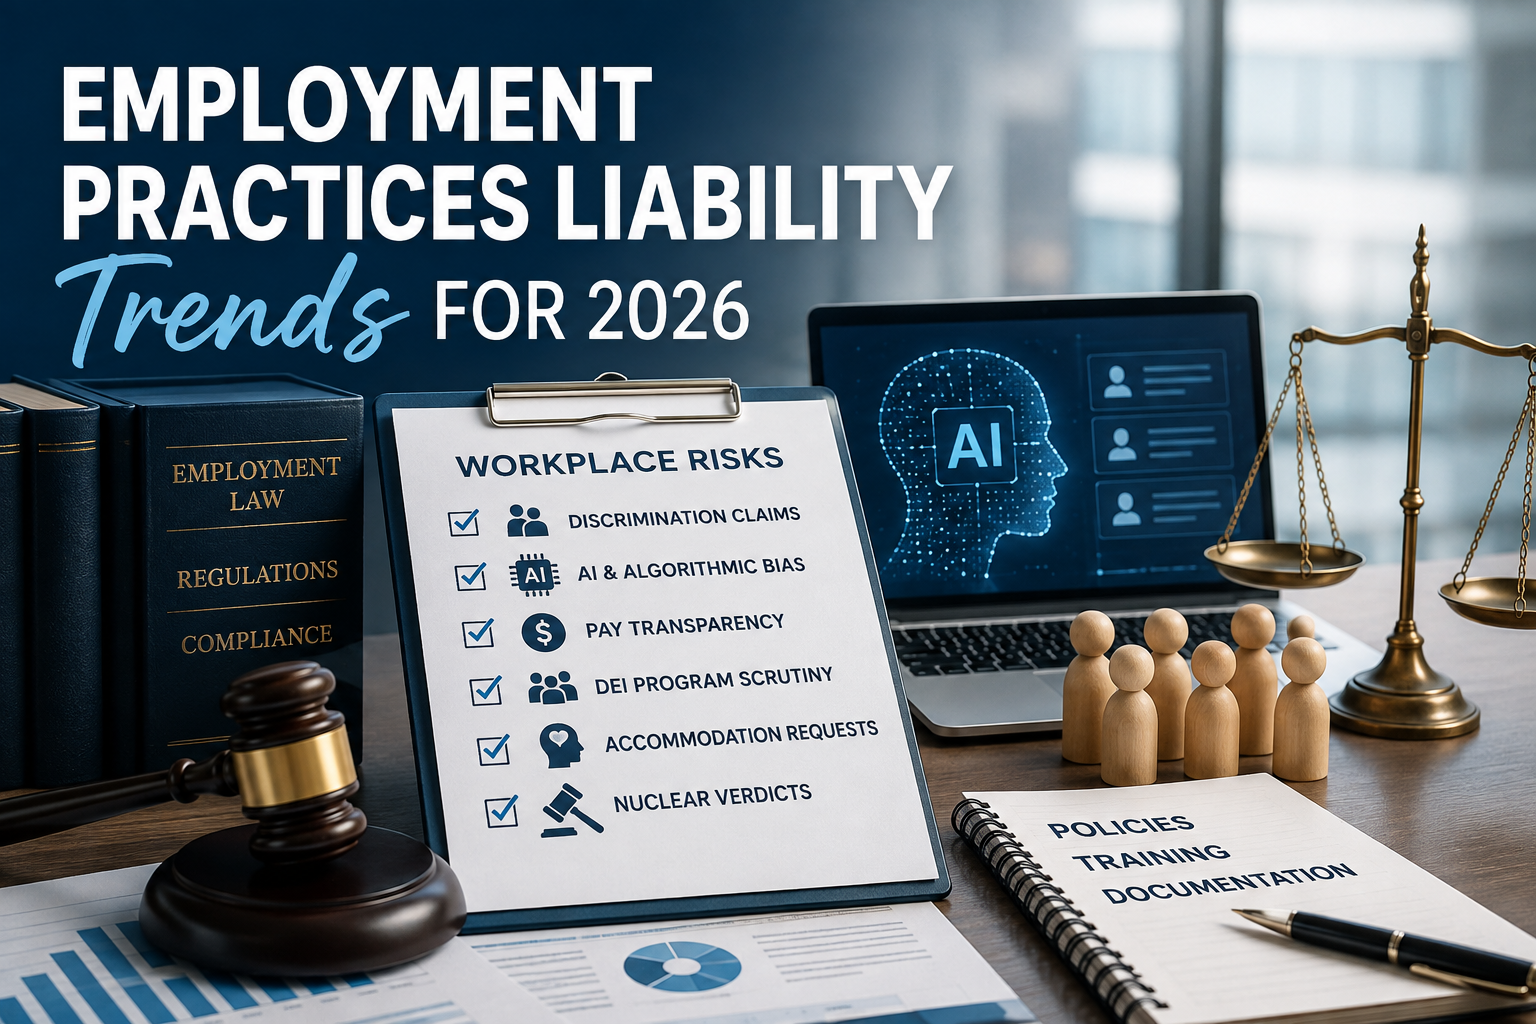
Employment practices liability risks are evolving as workplace regulations change, artificial intelligence becomes more integrated into HR decisions, and employees gain new protections. For employers, these changes can create greater exposure to discrimination claims, pay equity disputes, accommodation requests, and other employment-related litigation.

A recent Zurich report on employment practices litigation trends for 2026 highlights several developments businesses should be watching.

Read More

AI Changed Cybersecurity. Has Your Business Changed With It?

Jul 22, 2026, 12:50:48 PM / by DSP Insurance Services posted in Business Insurance

0 Comments

Most business owners believe they've checked the cybersecurity box. They have an IT provider. They've purchased cyber liability insurance. Their employees have completed phishing training. They've invested in technology and feel reasonably confident they're protected.

A few years ago, that may have been enough.

Today, it isn't.

Read More

The Stop-Loss Attachment Point Buyer's Guide: How to Set the Number for 2027

Jul 14, 2026, 11:59:45 AM / by Blake Erickson posted in Employee Benefits

0 Comments

If you self-fund, your specific stop-loss deductible is the single largest risk-transfer decision on the plan. It determines how much of every catastrophic claim lands on your balance sheet before anyone else pays a dollar. And for most mid-market employers, it was not chosen. It was inherited, carried forward from the year the plan converted and nudged upward whenever the renewal got ugly.

That was survivable when million-dollar claims were rare. It is not survivable now.

This is a working guide to setting the number. What you are actually buying, what the 2026 claims data says about the risk you are absorbing, the contract terms that quietly move your real attachment point, and the questions to put in front of your carrier before you sign.

Start Here: What You Are Actually Buying

Stop-loss is not health insurance. It is reinsurance on your own plan. Two layers, two different jobs.

Layer What it protects How the threshold is expressed
Individual / Specific (ISL) Any one claimant running catastrophic. One premature birth. One leukemia diagnosis. One gene therapy. A flat dollar deductible per covered person, per contract year. Commonly $75,000 to $300,000 in the mid-market.
Aggregate (ASL) Everyone at once. A bad year across the whole population rather than one bad case. A percentage of expected claims, typically 125%. You fund up to the corridor before the carrier steps in.

Specific is the layer that keeps a CFO awake. Aggregate is the layer that gets ignored until the year it matters. Most mid-market plans carry both, and most employers can tell you their ISL number but not their aggregate attachment factor (if that is you, you are in good company, and we will come back to it).

The 2026 Numbers That Should Reset Your Assumptions

Before you pick a threshold, understand the distribution you are picking it against. The last four claim years have moved in one direction.

+46% Increase in the frequency of million-dollar-plus claims, 2022 to 2026 Sun Life, High-Cost Claims & Injectable Drug Trends (2026) 49% Of self-funded plan sponsors now report at least one $1M+ claim, up from 23% Aegis Risk Medical Stop-Loss Premium Survey
~20% Year-over-year rise in members exceeding $200,000 in annual claims per 10,000 employees QBE North America, 2026 Accident & Health Market Report 13-20%+ Stop-loss premium increases employers are seeing at renewal Gallagher, via BenefitsPRO (June 2026)

Three details inside that data matter more than the headlines:

The severity is concentrating at the top. Sun Life's 2026 report, built on more than 70,000 high-dollar claims from over 3,300 self-funded employers, found that blood cancers produced the highest multimillion-dollar claims, averaging $5.45 million in 2025. The single largest leukemia claim approached $8 million. The costliest drug treatment in the dataset was Elevidys, a gene therapy for Duchenne muscular dystrophy, at an average of $3.6 million per course.

The frequency is climbing right where mid-market deductibles sit. QBE's 2026 market report found neoplasm claim severity at the $200,000 deductible level rose 12% over the prior-year average, while frequency at that level climbed nearly 30%. Birth-related claim frequency more than doubled between 2024 and 2025. If your ISL is $150,000 or $200,000, that is not background noise. That is your layer.

The tail keeps stretching. Aegis now reports that one in six plan sponsors has seen a $3 million claim. A $3 million claim used to be a story people told at conferences. It is becoming a line item.

A high-cost claimant is no longer an outlier event you insure against. It is a recurring feature of a mid-market population that you have to price, fund, and plan for.

The Four Details That Help You Pick The Right Number

Not one of these is "what did the carrier quote."

1. Group size and claim credibility

The smaller the population, the less predictable the distribution and the more a single claimant distorts the year. A 120-life group and a 900-life group with the same expected PEPM are not carrying the same volatility, and they should not carry the same deductible. Larger groups can hold more retention because statistical smoothing works in their favor. Smaller groups cannot buy their way out of volatility with a high deductible. They just move the volatility onto the balance sheet.

2. Your actual claims distribution, not the market average

Pull three years of claimant-level data and count how many members landed in each band: $50k-$100k, $100k-$200k, $200k-$500k, $500k+. That histogram is your attachment point analysis. Everything else is commentary. Segal's national dataset found that claimants with $250,000 or more in annual paid claims represent under 1% of covered individuals but roughly 15% of total medical and pharmacy spend. Your version of that number is knowable, and it should be the basis of the decision.

3. Balance-sheet tolerance, stated as a hard dollar figure

Answer this before you look at a single quote: what is the maximum dollar amount of unbudgeted claim spend this company can absorb in a bad year without changing how it operates? Not what it would prefer. What it can survive. That number is the ceiling on your retained risk, and it belongs to the CFO, not the broker.

4. The premium-versus-retention trade, run as math

Raising your deductible always lowers the premium. That is not the question. The question is whether the premium you save is larger than the additional claim dollars you now expect to eat inside the new layer.

Run the Retained Layer Test

Here is the test in practice. The figures below are illustrative, chosen for clean arithmetic, not benchmarks. Your actual PEPM depends on demographics, geography, industry, and experience.

Take a 250-employee self-funded group weighing a move from a $100,000 ISL to a $200,000 ISL.

  Option A: $100,000 ISL Option B: $200,000 ISL
Specific premium (illustrative) $180 PEPM = $540,000/yr $115 PEPM = $345,000/yr
Annual premium saved by moving to Option B $195,000
New corridor you now self-fund Every dollar between $100,000 and $200,000, on every claimant

Now cost the corridor using the group's own history. Say the last three years averaged five claimants above $100,000: three of them ran past $200,000, and two landed around $140,000.

  • The three claimants above $200,000 each cost you an additional $100,000 under Option B. That is $300,000.
  • The two claimants at roughly $140,000 cost you an additional $40,000 each. That is $80,000.
  • Expected additional retained claims: $380,000. Premium saved: $195,000.

Option B loses by roughly $185,000 a year. The cheaper premium is the more expensive decision, and you only see that if you cost the layer instead of comparing the quotes.

Reverse the population and the answer reverses with it. A group with one claimant a year clearing $100,000 and none clearing $200,000 is paying a large premium to insure a corridor almost nobody enters. That group should raise the deductible.

The test, stated plainly

Move the deductible up only when:

Premium saved > expected claim dollars inside the new corridor, and the worst realistic year inside that corridor still fits under the CFO's hard dollar ceiling.

The Contract Terms That Shift Your Attachment Point

This is where mid-market employers get hurt, and it is the part almost nobody reads. Your effective attachment point is not just the number on the first page. It is the number after the contract mechanics are applied.

Contract basis (12/12, 12/15, 24/12, paid)

A 12/12 contract covers only claims incurred and paid inside the same 12 months. A claim incurred in November and paid in February may fall into no one's coverage. Paid contracts are the cleanest. Every step away from paid is a step toward a gap, and carriers discount premium precisely because the coverage is narrower. Cheap premium on a 12/12 is not savings. It is a deductible you did not know you bought.

Run-in and run-out limits

When you change carriers, the claims incurred under the old contract but paid under the new one need a home. Confirm in writing which contract picks them up. This is the most common way a clean-looking marketing exercise creates a six-figure uncovered claim on your largest, longest-running case.

Aggregating specific deductible (ASD)

An ASD lowers your per-person deductible but stacks a second, pooled deductible on top: you might get a $100,000 specific with a $150,000 aggregating specific, meaning you absorb the first $150,000 of the total excess across all breaching claimants before reimbursement starts. It is a legitimate tool for cash-flow-strong employers who want cheaper premium. It is also a way to think you bought a $100,000 attachment point when your first real dollar of recovery is much further out.

Lasers and the no-new-laser provision

A laser is a higher deductible applied to one identified claimant. Your group is at $200,000; the member with a known transplant history is set at $600,000. The first $600,000 of that member's claims is yours.

Lasers are increasingly common as carriers get better at reading your data. Three responses: accept the laser and fund it, buy it out with additional premium, or market the risk to a carrier willing to take the member at the standard level. What you cannot do is treat it as a footnote. A single laser can create a six-figure gap between your assumed exposure and your actual exposure.

And ask for the no-new-laser provision at renewal, along with the rate cap that usually rides with it. Those two clauses together are often worth more than a few points of premium.

The gap that shows up after you switch

Terminal liability. If you leave a carrier and your contract does not extend to claims incurred but not yet paid, that run-out sits on your plan with no reinsurance behind it. Run-out provisions vary carrier to carrier: some cover 12 months, some cover nothing. Confirm it before you move, not after.

The Aggregate Corridor You Have Not Looked At

Aggregate stop-loss caps total plan claims, usually at 125% of expected. The math is simple: expected annual claims times 1.25. Everything below that line is yours.

For a group with $3 million in expected claims, the aggregate attachment sits at $3.75 million. That means a bad year can cost you $750,000 above budget before the aggregate policy pays anything. The question is not whether the corridor is standard. It is whether your cash reserves and credit facility can absorb a bad run.

Aggregate matters most for smaller groups, where two or three large claimants can swing total plan cost by 30% in a year. For a 500-life group, statistical smoothing makes an aggregate breach genuinely unlikely, and the coverage is closer to a formality. Know which one you are before you dump a bunch of money into it.

One structural note worth understanding: aggregate typically only counts claims up to your specific deductible. Amounts above the ISL that the specific policy reimburses do not accumulate toward the aggregate. Employers routinely misread this and assume they have more protection than they have bought.

Your Pre-Renewal Checklist

Stop-loss renewal work should start 120 days before the effective date. Not 30. By 30 days, you are accepting terms, not negotiating them.

120-180 days out: build the fact base

  • ✓  Pull 36 months of claimant-level data and build the distribution histogram by dollar band.
  • ✓  Identify every claimant currently trending above 50% of your ISL. These are your laser candidates. Your carrier already knows who they are.
  • ✓  Get the CFO's hard dollar ceiling for unbudgeted claim spend.
  • ✓  Confirm your current contract basis, ASD (if any), run-in/run-out, and any active lasers.

90-120 days out: model the options

  • ✓  Price at least three ISL levels, not two. Two options invite a coin flip; three reveal the curve.
  • ✓  Run the Retained Layer Test at each level against your own claim history.
  • ✓  Model the worst realistic year at each level, not the expected year, and check it against the CFOs maximum.
  • ✓  Price the aggregate corridor as a cash requirement, not an insurance product.

60-90 days out: negotiate the terms, not just the rate

  • ✓  Ask for the no-new-laser provision and the renewal rate cap in the same conversation.
  • ✓  Quantify the buyout premium on any existing laser and compare it to the retained exposure.
  • ✓  Confirm terminal liability and run-out coverage in writing before entertaining a carrier change.
  • ✓  Verify how specialty pharmacy and gene therapy are treated under the contract, including any carve-outs or separate accumulators.

Four questions to ask your carrier or broker:

  • At this attachment point, how many members do you statistically expect to breach it?
  • What is the modeled probability of a single claim exceeding $1 million, and exceeding $3 million, in our population?
  • How does our pharmacy trend impact expected claim frequency at each ISL option you have quoted?
  • What exactly is covered, and what is excluded, if a member is approved for a cell or gene therapy mid-contract?

Where Mid-Market Employers Get Burned

Five patterns, in rough order of how expensive they turn out to be.

  • Buying the premium, not the layer. Choosing the deductible that produces the lowest quote without ever costing the corridor you just took on. This is the mistake that fails the Retained Layer Test above, and it is the most common one on the list.
  • Letting the number sit still while trend moves. A $200,000 attachment point set in 2022 does not protect what it protected in 2022. With medical trend running near 9% and pharmacy at 11% to 12%, your claims retention and premium have been growing every year you kept it flat. Carriers reprice for leveraged trend annually. Your retention analysis should too.
  • Reading the rate and skipping the contract. Contract basis, aggregating specific deductibles, and run-out terms can move your effective attachment point by six figures. They are not fine print. They are the product.
  • Treating a laser as an administrative note. Every laser is a funded liability. Model it, price the buyout, or shop it.
  • Setting the deductible so low the carrier becomes your claims administrator. A $50,000 or $75,000 ISL on a healthy mid-market group means you are paying catastrophic-level pricing to insure predictable large claims. You can budget for a $75,000 claim. You cannot budget for a $3 million one.

The Decision Underneath the Decision

Self-funding is a bet that you can manage your own risk better than a carrier will price it for you. The attachment point is where you declare how much of that bet you are actually willing to hold.

The market has made that declaration harder. Level-funded arrangements alone now cover 37% of workers at firms with 10 to 199 employees, per KFF, which means far more small and mid-market employers are exposed to stop-loss volatility than were a decade ago. They are exposed at exactly the moment claim severity is accelerating. More employers holding the risk. Bigger claims arriving. Premiums up mid-teens or worse.

None of that argues for retreating from self-funding. It argues for doing the analysis that self-funding always assumed you were doing. Pull the data. Build the histogram. Price your exposure. Read the contract. Then set the number, on purpose, with a reason you can defend to your CFO.

Let's put a number behind your number.

DSP's employee benefits team runs claims distribution analysis, stop-loss contract review, and retained-risk modeling for mid-market self-funded and level-funded employers. If your renewal is inside 120 days, or you have never seen your own claimant histogram, that is the conversation to have.

Talk to Our Benefits Team Explore Employee Benefits

Or call 847-934-6100  |  info@dspins.com

Sources

  1. Sun Life U.S., High-Cost Claims and Injectable Drug Trends report (May 2026). Million-dollar-plus claim frequency +46% from 2022 to 2026; blood cancers averaged $5.45M in 2025; Elevidys averaged $3.6M.
  2. QBE North America, 2026 Accident and Health Market Report, as reported by Insurance Business (June 2026). Neoplasms account for 36% of stop-loss claim reimbursements; frequency of members exceeding $200,000 per 10,000 employees up nearly 20% year over year.
  3. Aegis Risk Medical Stop-Loss Premium Survey. 49% of plan sponsors report $1M+ claims, up from 23%; one in six report a $3M claim.
  4. Segal, Medical Stop-Loss Premiums Increase Nearly 10 Percent. Claimants at $250,000+ represent under 1% of covered individuals and about 15% of total medical and pharmacy spend.
  5. Allison Bell, Health stop-loss increases keep slamming employers, BenefitsPRO (June 22, 2026). Gallagher reports stop-loss increases in the mid-teens, in some cases above 20%.
  6. Business Group on Health, 2026 Employer Health Care Strategy Survey. Median health care cost trend of 9% for 2026; pharmacy costs forecast up 11% to 12%.
  7. KFF, 2025 Employer Health Benefits Survey. 37% of covered workers at firms with 10 to 199 employees are covered by a level-funded plan.

This article is for educational purposes and reflects general market conditions as of July 2026. It is not tax, legal, actuarial, or insurance advice. Stop-loss contract terms, pricing, and availability vary by carrier, group, and state. Consult a licensed professional for guidance specific to your plan. The premium and claim figures in the worked example are illustrative and chosen for arithmetic clarity, not benchmarks.

Read More

Unlocking Greater Bonding Capacity: How the SBA Surety Bond Guarantee Program Can Bridge the Gap

Jun 24, 2026, 1:12:16 PM / by Damien Strohmier posted in Surety

0 Comments

For a growing construction or service contractor, few things are more frustrating than watching a contract opportunity pass by simply because the bonding capacity isn't there yet. The work is there. The manpower is there. The track record is building. But the balance sheet hasn't caught up, and the traditional surety market is not in the business of waiting.

Understanding why that gap exists, and how to bridge it strategically, is one of the most valuable conversations a growing contractor can have.

Read More

The Prescription Drug Machine: What Employers Need to Know About Rising Pharmacy Costs

Jun 11, 2026, 9:22:24 AM / by DSP Insurance Services posted in Employee Benefits

0 Comments

Prescription drug costs have become one of the fastest-growing expenses in employer-sponsored health plans. Yet despite representing a significant portion of overall healthcare spending, pharmacy benefits remain one of the least understood components of a health plan. 

Read More

Subscribe to Email Updates

Recent Posts

World-class service and insurance solutions around the globe.

World-class service and insurance solutions around the globe.

World-class service and insurance solutions around the globe.